Among the insights revealed by a new tool that shows how racism affects food insecurity is that Black Americans in Midwest metropolitan areas are more likely than those in the South to suffer from food insecurity.
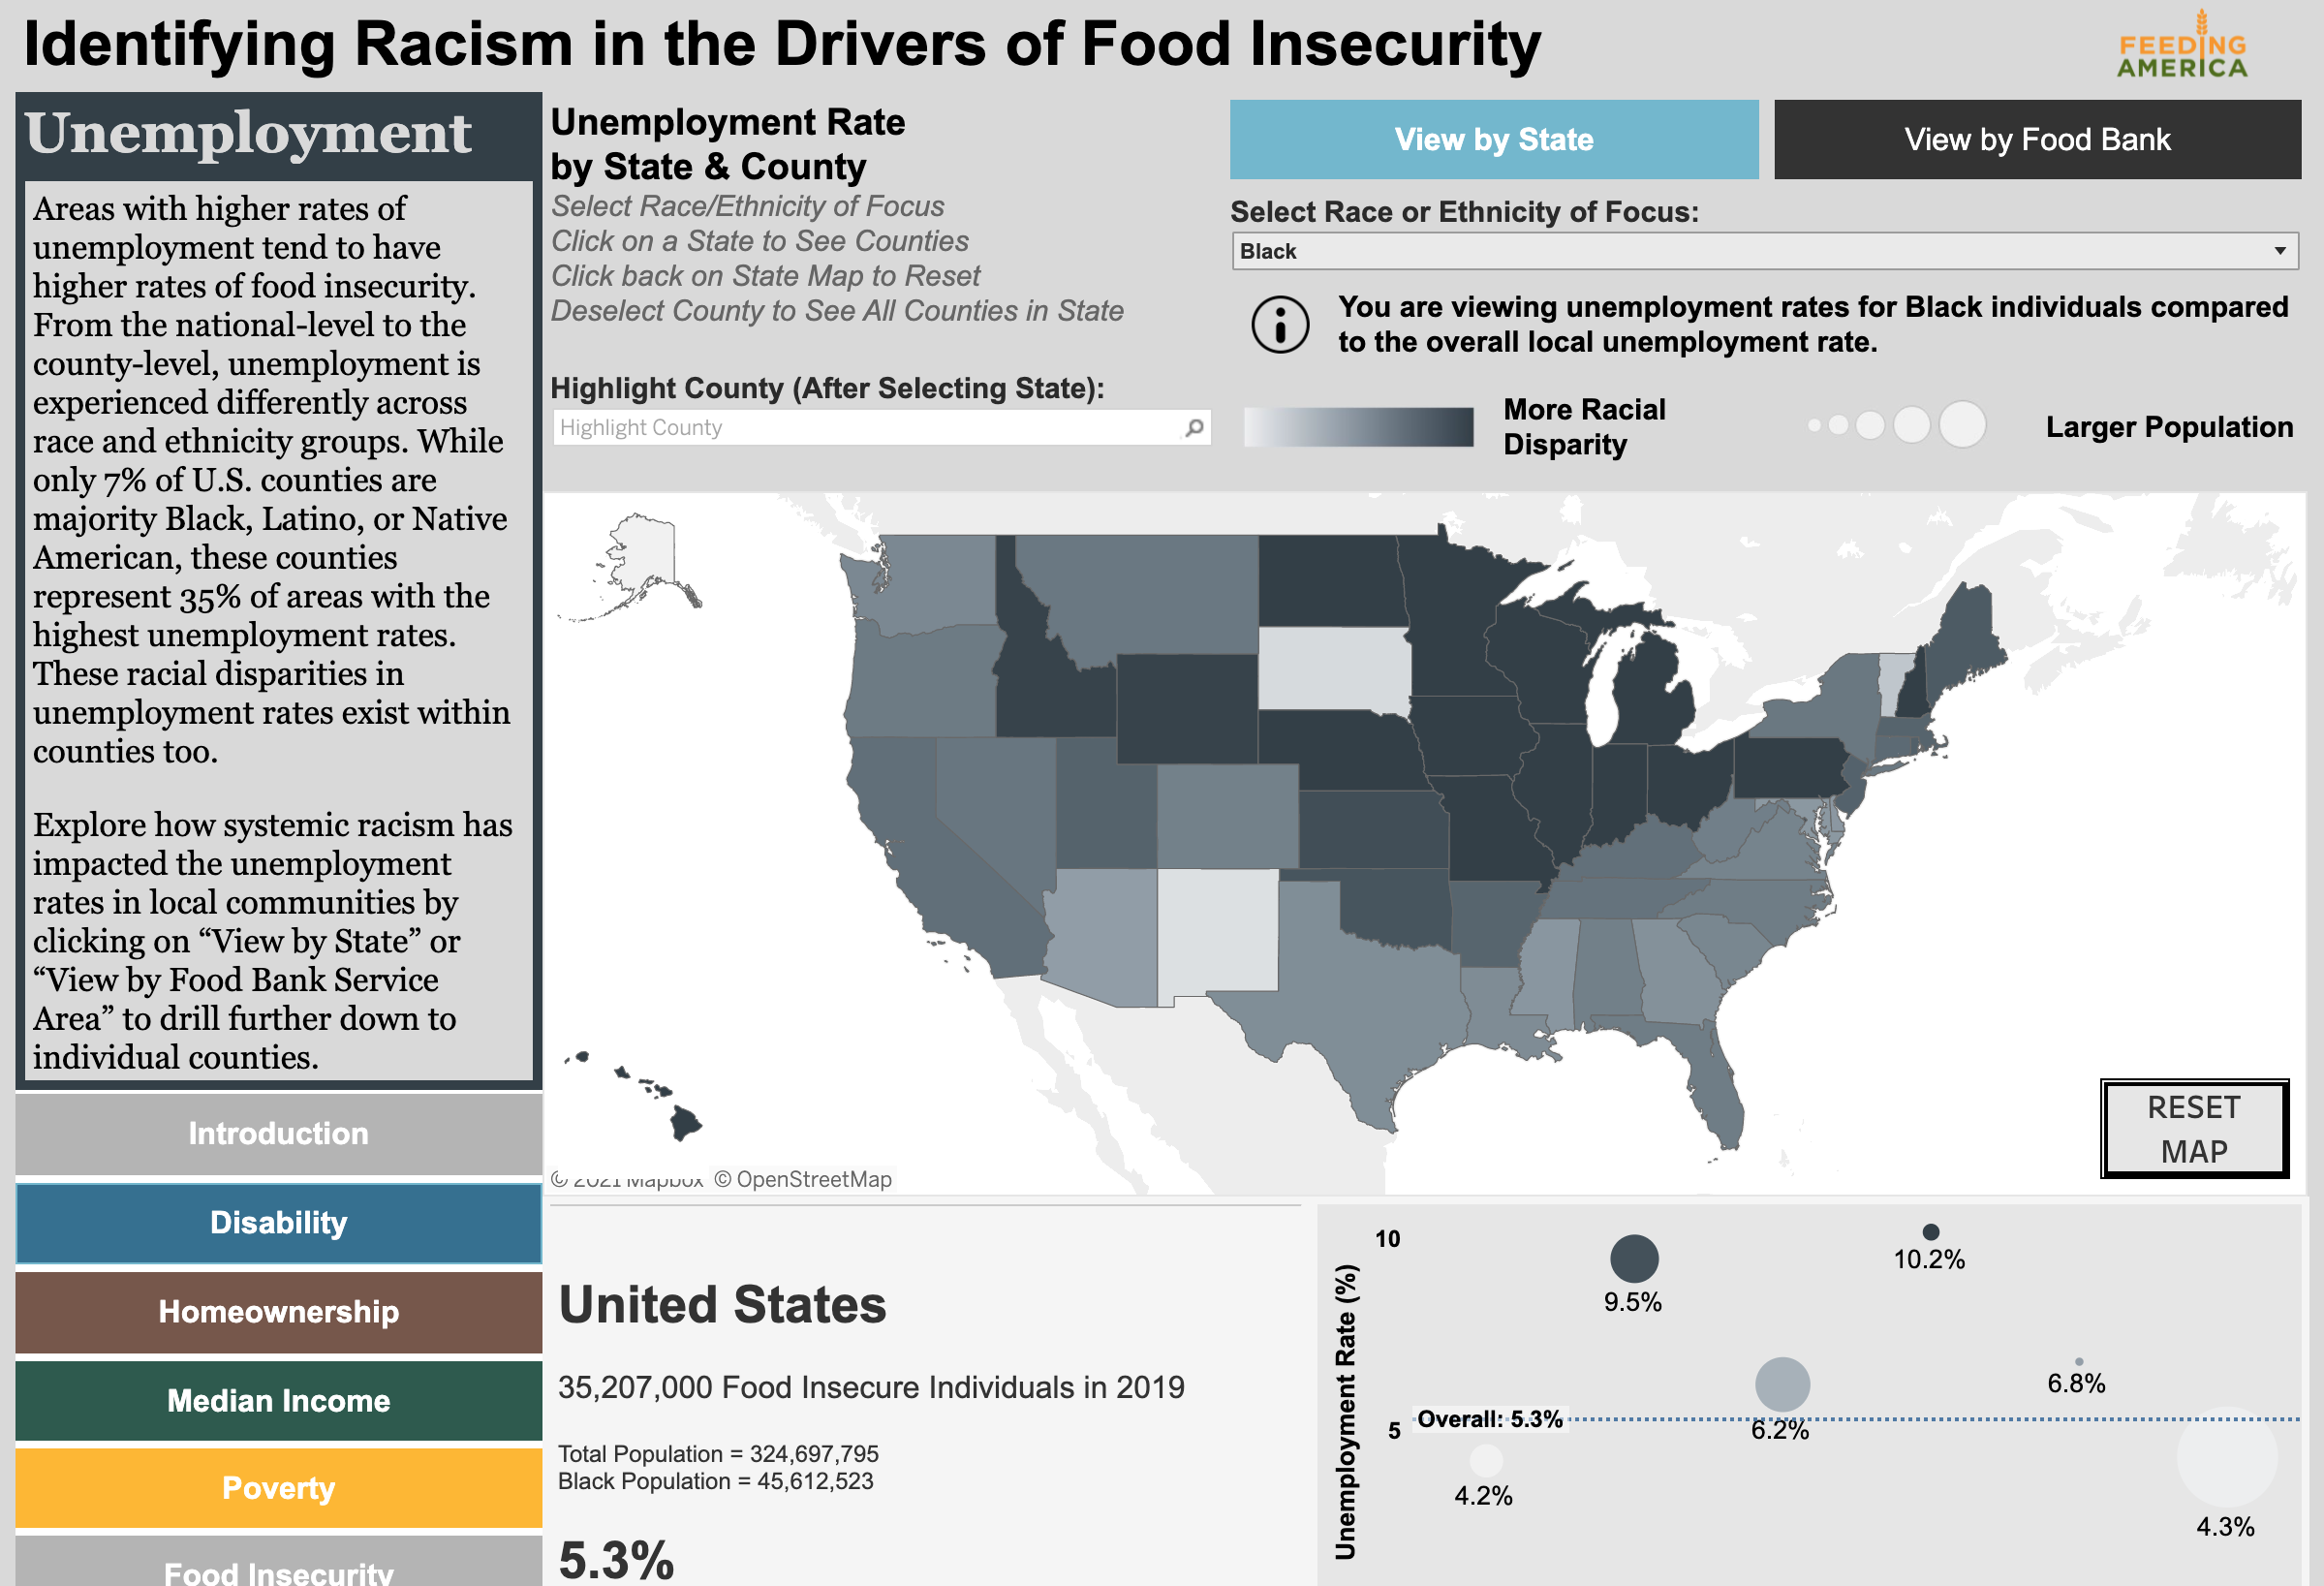
Feeding America collaborated with Tableau to publish “Identifying Racism in the Drivers of Food Insecurity,” an interactive tool that explores how systemic racism drives disparities within five economic indicators that impact one’s ability to access food — poverty, unemployment, income, homeownership, and disability status.
The tool lets readers filter results for different ethnic groups by state, county, and food bank service areas. It accounts for the fact that very wealthy residents in certain areas may distort the overall results, and so tells a fuller story of the wide disparities between the most privileged and the more impoverished in specific areas.
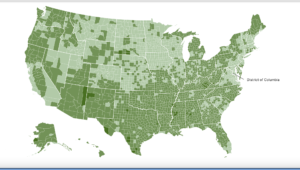
A cursory look at the United States, for example, will show that Arkansas, Louisiana, Mississippi, and Alabama have the highest levels of food insecurity in the country. But when broken down into the five food insecurity indicators, it is clear that racial disparity is more severe in the Midwest.

“A lot of people perceive things as really bad in the South for Black persons,” said Dr. Craig Gundersen, a member of Feeding America’s Technical Advisory Group who recently became an endowed professor at the Baylor Collaborative on Hunger and Poverty. “When it comes to food insecurity in metro areas, this is not the case.”
Cities often fall prey to population averages making food insecurity and other disparities look less severe than they are. But for every wealthy person pulling the average up, somebody in poverty pulls the average down. By using the tool, the differences between race and ethnicity become easier to spot.
Gundersen noted, “Chicago is in Cook County and has zip codes that are majority Black, which have all the highest rates of food insecurity in Chicago. The same holds for Milwaukee County, which has Milwaukee, the same holds for Hennepin County, which has Minneapolis, and the same holds for Wayne County, which has Detroit.”
The lesson is that even though a state or county may look like it’s doing well, an actual tale of two cities is often occurring at the zip code level. According to Gundersen, “The main story about race differences in the United States is the history of segregation in northern cities.”
Food banks should use the Feeding America/Tableau tool to direct a proportionate amount of services to the hardest hit zip codes within their district.
Food banks can also use the tool to monitor the disability rate of the population in their district. Having a disabled child or parent in a household increases the probability of food insecurity, and having physical or mental disabilities can make traveling to a food pantry a daunting, if not insurmountable, task.
At first glance, disability in the United States affects ethnicities more evenly than other factors, with Black, Native American, and white residents polling over the national average of 12.6%. However, the white population represents over 60% of the United States with 14% disabled, while the Black population represents only 14% of the total population but also has 14% disabled. For Native Americans, the situation is even more severe. At less than 2% of the national population, they have a disability rate of almost 17%.
In California, some counties have Black disability rates over 300% of the national rate, while Colorado has counties where Native American disability rates are nearly 200% more than the national rate.
Food banks servicing these areas should consider alternative methods of assistance. Delivery services, online ordering, and technologies that accommodate handicaps can be tremendous improvements for the disabled.
Gundersen, who analyzed 2019 American Community Survey data for the Feeding America/Tableau tool, recommends using it in conjunction with Feeding America’s Map the Meal Gap tool, to which he also contributed data analysis efforts. While “Identifying Racism in the Drivers of Food Insecurity” identifies disparities down to a county level, “Map the Meal Gap” drills down food-disparity information to the zip code. — Zachary Smith
Zachary Smith is a freelance reporter and student at the Craig Newmark Graduate School of Journalism at CUNY, where he specializes in health and data reporting. Formerly an intern with Food Bank News, Zachary has recently been published with Everyday Health, Bklyner, and the NYCity News Service.