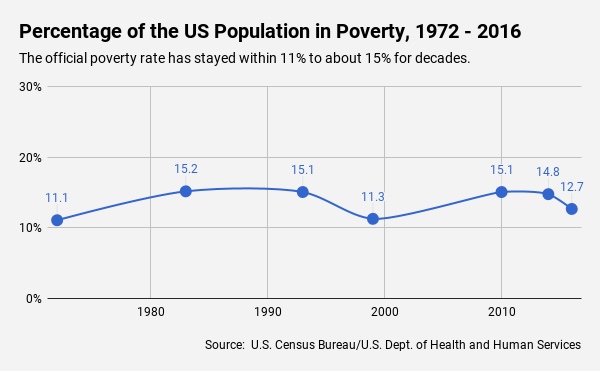
Poverty has proven hard to beat in America, declining slightly in the most recent estimates, but still barreling along at between 11% and 15% of the total population, as it has for decades. The official poverty rate of 12.3% in 2017 inched down from 12.7% in 2016 and 13.5% in 2015, according to the U.S. Census Bureau, yet remains well within the range it has held to since the late 1960s.
Even when viewed from a different perspective, poverty rates have remained consistent. Under the Supplemental Poverty Measure, which the Census Bureau has been publishing since 2011, poverty rates have continued to hover in the range of 14% to 16% of the population. The SPM seeks to update the 50+-year-old official rate by taking into account benefits that a household might receive, such as housing subsidies, Social Security and SNAP, while also subtracting unavoidable expenses, like health care and child care. It’s not intended to be used as an official measure to help set benefits, but rather to provide a more detailed look at poverty in America, including how government aid, taxes, and modern-day expenses affect it.
While the persistence of poverty from both perspectives may be disheartening, the view is at least better than what would have been without the federal safety net. Without Social Security, for example, the SPM in 2017 would have been 8.4 percentage points higher, putting 27 million more people into poverty, according to the Census Bureau. Without SNAP, 3.4 million more would be below the poverty line. At the same time, the SPM shows that various expenses are having the opposite effect. Health care costs, for example, plunged 10.9 million into poverty in 2017, says the Census Bureau.
At its current official rate, poverty remains a day-to-day reality for 40 million people in America. Until our society cracks the code on poverty, those who live it are likely to continue to seek assistance from food banks all across the country.
